
Playbook: Turn Community Signals Into Business Outcomes
# Community
# Format: Playbooks
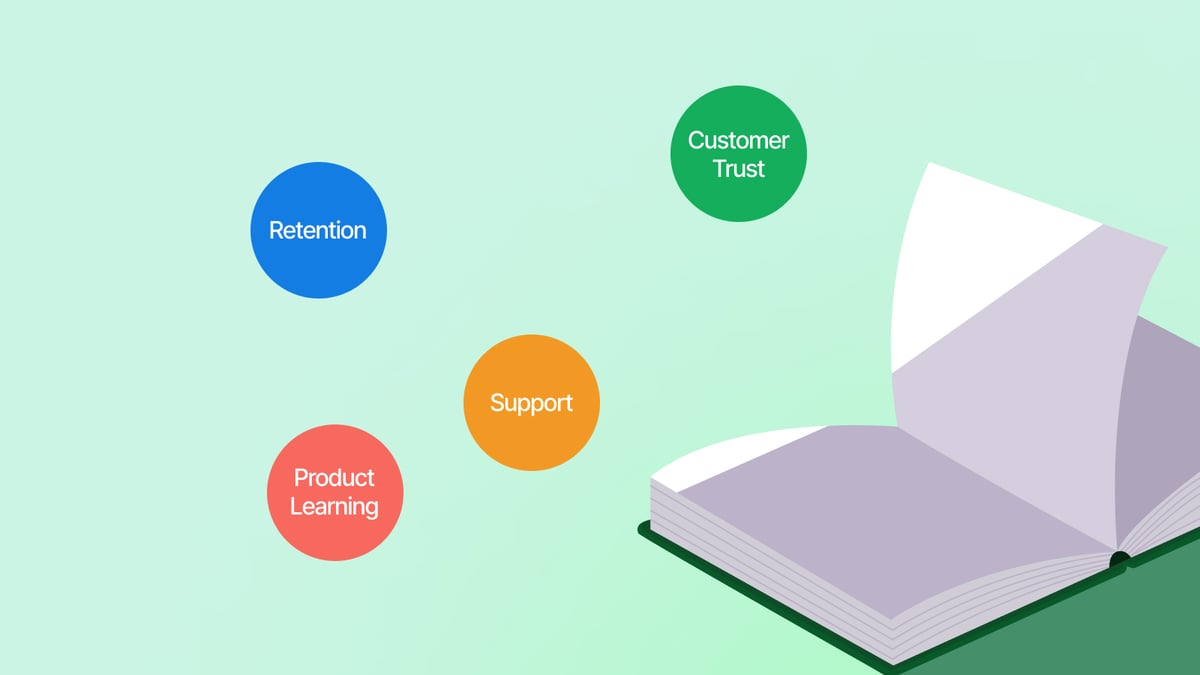
A practical guide to identifying the community behaviors that may influence revenue, retention, support, product learning, and customer trust.
July 23, 2026
Mark Birch

Joshua Zerkel
Community teams usually have more signals than they realize. Every event registration, forum reply, peer answer, resource view, feedback thread, GitHub contribution, customer introduction, and repeat visit can help explain how people are interacting with the community. The problem is that most of those signals are easy to collect and hard to interpret.
A signal is an observable behavior that may indicate something meaningful about a member, account, or customer relationship. Signals do not prove business impact on their own. They help point toward where impact may be happening and what the team should study more closely.
This distinction is important for community measurement because many teams either overstate what a signal proves or underuse the signals they already have. Attendance becomes “pipeline influence” without enough context. Member growth becomes “community health” without a deeper view of who is participating and why. A high number of posts becomes “engagement” without understanding whether those conversations are helping customers, surfacing product needs, or strengthening relationships.
The goal is to build a more disciplined way of reading community behavior. Community teams need to understand what a signal might suggest, which business outcome it may connect to, and what additional evidence would make that connection more credible. That work creates the bridge between community activity and the outcomes executives already recognize.
Start by inventorying the signals you already have
Most community teams do not need to begin by creating new data. They usually need a clearer inventory of the data already being created across their programs and systems.
A signal inventory should include the places where members participate, the behaviors that happen in those places, and the available data tied to those behaviors. This may include activity from a community platform, event platform, CRM, support tool, product feedback system, marketing automation tool, GitHub, Slack, Discord, Discourse, LinkedIn, or customer success platform.
The first pass should stay practical. The goal is not to capture every possible action. The goal is to identify the behaviors that may carry meaning for the business. A registration for a webinar may be useful, but repeat attendance across several customer education sessions may tell a stronger story. A single product comment may be interesting, but repeated feedback from strategic accounts may be more valuable. A member joining a group may be a light signal, while that same member answering peer questions over several months may suggest deeper trust and expertise.
A useful inventory might include:
- Event attendance, repeat attendance, and questions asked during live sessions
- Forum posts, replies, accepted answers, and peer-to-peer support behavior
- Resource views, downloads, and repeat engagement with educational content
- Product feedback themes, beta participation, and roadmap discussion activity
- Advocacy actions, referrals, references, reviews, or customer story participation
- Account-level participation across programs, regions, lifecycle stages, or segments
This inventory helps the team see what is available before deciding what matters. It also surfaces gaps. Some signals may be easy to collect but not very meaningful. Others may be highly valuable but hard to access because they live in systems owned by another team.
Group signals by what they may suggest
Once the team has a clear inventory, the next step is to group signals by the kind of business meaning they may carry. Treating all engagement as equal makes community reporting weaker. A reaction, a thoughtful reply, a product workaround, and a customer reference are all forms of activity, but they suggest very different things.
A practical signal map groups community behaviors by the type of value they may indicate. This gives the team a more useful lens than raw volume.
Education signals may include onboarding session attendance, product learning content engagement, questions asked by newer members, or repeat participation in training-focused programs. These signals may connect to product adoption, onboarding success, customer confidence, or reduced support burden.
Support signals may include peer replies, accepted answers, recurring troubleshooting themes, member-generated resources, or experienced customers helping newer ones. These signals may connect to support deflection, customer satisfaction, and faster problem resolution.
Trust signals may include repeat participation, member-to-member introductions, direct responses to company-led discussions, or participation from senior stakeholders at customer accounts. These signals may connect to retention, advocacy, expansion readiness, or account health.
Product learning signals may include feedback themes, beta participation, roadmap discussions, usage ideas, friction points, and repeated questions about the same feature or workflow. These signals may connect to product discovery, roadmap confidence, adoption, and innovation.
Growth and advocacy signals may include referrals, public recommendations, speaking interest, customer story participation, reference willingness, or social sharing. These signals may connect to demand generation, pipeline influence, brand trust, and sales enablement.
Grouping signals this way helps community leaders avoid presenting a long list of disconnected metrics. It also makes the reporting more useful to cross-functional teams. Product leaders can more easily understand product learning signals. Customer success leaders can more easily understand education and support signals. Finance can more easily understand how these signals may eventually connect to efficiency, retention, or growth.
Connect each signal group to a business outcome
The next step is to connect signal groups to outcomes the organization already tracks. This is where community measurement often becomes more credible because the team is no longer asking the business to accept community-specific metrics in isolation.
The connection should be specific enough to be useful and careful enough to avoid overclaiming. A signal can suggest a relationship without proving causation. Community teams should be clear about what they know, what they suspect, and what they are still testing.
For example, repeat attendance in customer education programs may connect to product adoption or renewal readiness. The team may not be able to prove that attendance caused retention, but it can compare adoption and retention patterns between customers who attended and customers who did not.
Peer-to-peer support behavior may connect to support efficiency and customer experience. The team may not be able to claim that every peer answer prevented a ticket, but it can study whether accounts with active peer support participation submit fewer repetitive support requests or resolve common issues faster.
Product feedback discussions may connect to roadmap confidence and innovation. The team may not be able to assign a direct financial value to every comment, but it can show how community feedback clarified customer needs, revealed friction points, or helped validate a product decision.
A simple mapping structure can help:
- Signal group: Customer education participation
- Community behavior: Repeat attendance at onboarding and product learning sessions
- Possible outcome: Product adoption and renewal readiness
- Evidence to review: Usage data, renewal data, customer health scores, support tickets, lifecycle stage
This kind of mapping makes the logic visible. It helps the team explain why a signal matters and what evidence would make the relationship stronger.
Look at signals at the account level
Community activity is often reported at the individual member level, while business outcomes are frequently evaluated at the account level. This mismatch can make community impact harder to see.
A customer may have five employees engaging in different ways. One attends events, another asks product questions, another answers peer questions, and another provides feedback to the product team. Looking only at individual participation may make the activity seem scattered. Looking at the account level may reveal that the company is deeply engaged with the community across multiple touchpoints.
Account-level signal mapping is especially useful for B2B communities because it helps connect community behavior to the way sales, customer success, finance, and leadership already evaluate customer relationships.
A basic account-level view might include:
- Number of active community participants from the account
- Types of programs or spaces they engage with
- Repeat participation over time
- Support, feedback, advocacy, or education behaviors
- Lifecycle stage, renewal date, customer health score, product usage, or expansion history
This view can help community leaders ask better questions. Are highly engaged accounts renewing at different rates? Are customers who participate in education programs adopting more features? Are strategic accounts using the community to surface product needs? Are accounts with peer support activity submitting fewer repetitive tickets?
The goal is not to force every community action into an account score. The goal is to see whether community participation adds useful context to the customer relationship.
Compare engaged and non-engaged cohorts
Cohort comparison is one of the most practical ways to begin connecting community signals to outcomes. It gives the team a starting point, even if the data is not perfect.
A cohort is a group of customers or members who share a common characteristic. In this context, the simplest comparison is between customers who engage with the community and customers who do not. From there, the team can compare outcomes such as retention, expansion, product adoption, support usage, customer satisfaction, or feedback quality.
The comparison needs to be thoughtful. Engaged customers may already be more committed, better fit, or more mature than non-engaged customers. The community may be one factor among many. The team should avoid presenting correlation as proof of causation.
Even with that limitation, cohort comparison can be useful because it gives the organization something concrete to examine. If engaged accounts retain at a higher rate, that pattern is worth exploring. If customers who participate in product discussions submit more actionable feedback, that may support deeper investment in structured feedback programs. If members who attend onboarding events adopt key features sooner, that can help the community team partner more closely with customer success.
A first cohort analysis might compare:
- Engaged accounts and non-engaged accounts
- Event attendees and non-attendees
- Product feedback participants and non-participants
- Peer support contributors and passive members
- Repeat participants and one-time participants
This work is often most useful when it is framed as learning rather than final proof. The community team can bring the business into the analysis by saying, “Here’s the pattern we’re seeing. Here’s what we think it may mean. Here’s what we want to test next.”
Weight signals based on depth and intent
Not all signals should count equally. A member who clicks a link once is showing a different level of intent than a member who attends three sessions, asks questions, and later contributes feedback. A customer who reacts to a post is engaging differently from a customer who writes a detailed answer that helps another account solve a problem.
Signal weighting helps the team distinguish between light, moderate, and deep forms of engagement. It also makes measurement more aligned with how community actually creates value. Community impact often comes from depth, quality, and repeated participation, not just volume.
A simple weighting model might treat signals in tiers.
Light signals may include views, reactions, registrations, or one-time attendance. These suggest awareness or initial interest.
Moderate signals may include repeat attendance, comments, questions, group participation, or resource downloads. These suggest active learning or ongoing relevance.
Deep signals may include peer answers, accepted solutions, product feedback, beta participation, referrals, references, or customer story participation. These suggest trust, contribution, advocacy, or stronger relationship depth.
This kind of model does not need to be mathematically complex at first. Even a simple tiering system helps the team have a more nuanced conversation. Instead of reporting that an account had “ten engagements,” the team can explain that the account showed a mix of education, support, and product feedback signals, including several deeper behaviors that may indicate stronger connection to the company.
Signal weighting also helps the team design better programs. If deeper signals are more closely connected to outcomes, the community team can focus less on generating activity for its own sake and more on creating conditions for meaningful participation.
Build a simple signal-to-outcome report
Once the team has inventoried, grouped, mapped, and weighted signals, the next step is to turn the work into a report people can actually use. The report should be simple enough for cross-functional partners to understand and focused enough to support decisions.
A useful signal-to-outcome report should show the business outcome being studied, the community signals included, the customer or account segment being reviewed, the patterns observed, and the questions still open. It should also make clear whether the team is presenting evidence, early correlation, or a hypothesis that needs more analysis.
A report might include:
- Outcome: Renewal readiness among strategic accounts
- Signal group: Education and peer support participation
- Segment: Enterprise accounts with renewals in the next two quarters
- Observation: Engaged accounts show higher repeat participation and fewer basic support questions
- Question to explore: Whether participation is associated with stronger renewal confidence or faster adoption of key features
This format keeps the conversation grounded. It avoids asking executives to interpret raw community activity on their own. It also avoids overstating what the team knows.
Over time, the report can become more sophisticated. The team may add trendlines, cohort comparisons, product usage data, account health scores, or revenue outcomes. The first version, however, should be understandable, credible, and useful in conversation.
Use the signal map to improve the community
The value of signal mapping is not limited to reporting. It should also help the team make better decisions about the community itself.
If education signals are connected to adoption, the team may invest more in onboarding programs, office hours, or practitioner-led learning. If peer support signals are connected to customer confidence, the team may create clearer pathways for experienced members to answer questions and be recognized. If product learning signals are valuable to internal teams, the community may need more structured feedback loops and better ways to summarize recurring themes.
The signal map gives community leaders a way to evaluate whether programs are producing the kinds of behaviors that matter. It can also help them decide where not to invest. A program that generates attendance but no deeper engagement may need to be redesigned. A discussion space with low volume but high-value product insight may deserve more internal visibility. A small group of deeply active members may matter more than a larger group of passive members.
This is where measurement becomes more useful for the community team itself. It helps move the work from proving value after the fact to designing for the kinds of participation that create value over time.
Key takeaways
- Community signals are observable behaviors that may indicate something meaningful about a member, account, or customer relationship.
- Signals become more useful when they are grouped by the kind of value they suggest, such as education, support, trust, product learning, or advocacy.
- Community teams should connect signal groups to business outcomes the organization already tracks.
- Account-level signal mapping can help B2B teams connect individual participation to customer relationship health.
- Cohort comparison is a practical starting point for understanding how engaged and non-engaged customers differ.
- Signal weighting helps teams distinguish light engagement from deeper behaviors that may carry stronger business meaning.
- A signal-to-outcome report should present observations, patterns, and open questions without overstating what the data proves.
FAQ
What is a community signal?
A community signal is an observable behavior that may indicate something meaningful about a member, account, or customer relationship. Examples include event attendance, peer replies, accepted answers, product feedback, repeat participation, referrals, or customer story participation.
How do community signals connect to business outcomes?
Community signals connect to business outcomes when teams map behaviors to results the organization already tracks. For example, repeat education participation may connect to product adoption, while peer support activity may connect to support efficiency or customer satisfaction.
Should all community engagement be measured the same way?
No. Different behaviors carry different levels of meaning. A reaction or view is usually a lighter signal than repeat attendance, product feedback, peer support, or advocacy. Signal weighting helps teams understand the depth and intent behind participation.
What is the easiest way to start mapping signals?
Start by choosing one business outcome, such as retention or product adoption. Then identify the community behaviors that may influence that outcome, find where those signals live, and compare patterns between engaged and non-engaged customers.
Like
Comments (0)
Popular

Dive in
Related
Resource
Playbook: How To Turn Customer Stories Into Usable Signals
By Audrey Vandenbroeck • Jun 23rd, 2026 • Views 19
Resource
Playbook: Turning Community Insights into Business Impact
By Brian Oblinger • Dec 5th, 2025 • Views 43
Resource
Playbook: Turning Human Connection Signals into Community Intelligence
By Joshua Zerkel • Dec 5th, 2025 • Views 71
Resource
Playbook: How To Turn Internal Skeptics Into Community Champions
By Ashley Williams • May 7th, 2026 • Views 59
Resource
Playbook: How To Turn Customer Stories Into Usable Signals
By Audrey Vandenbroeck • Jun 23rd, 2026 • Views 19
Resource
Playbook: Turning Human Connection Signals into Community Intelligence
By Joshua Zerkel • Dec 5th, 2025 • Views 71
Resource
Playbook: How To Turn Internal Skeptics Into Community Champions
By Ashley Williams • May 7th, 2026 • Views 59
Resource
Playbook: Turning Community Insights into Business Impact
By Brian Oblinger • Dec 5th, 2025 • Views 43